Stack Trace Visualizer
An interactive graphical interface to visualize the Java call stack.
Documentation / Development Logs
Usage
- Run the program. If the application you are trying to trace is a command line application, run the following command in your terminal:
java -jar StackTraceVisualizer.jarOtherwise, you can launch the
.jarexecutable like any other program. -
A diaglog box will appear, prompting you for the full path to your program’s
.classfile.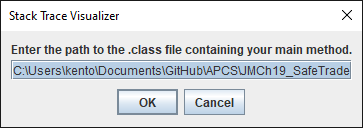
Make sure the path is a
.classfile. All.javafiles in the same parent directory as the specified.classfile will be recompiled automatically. -
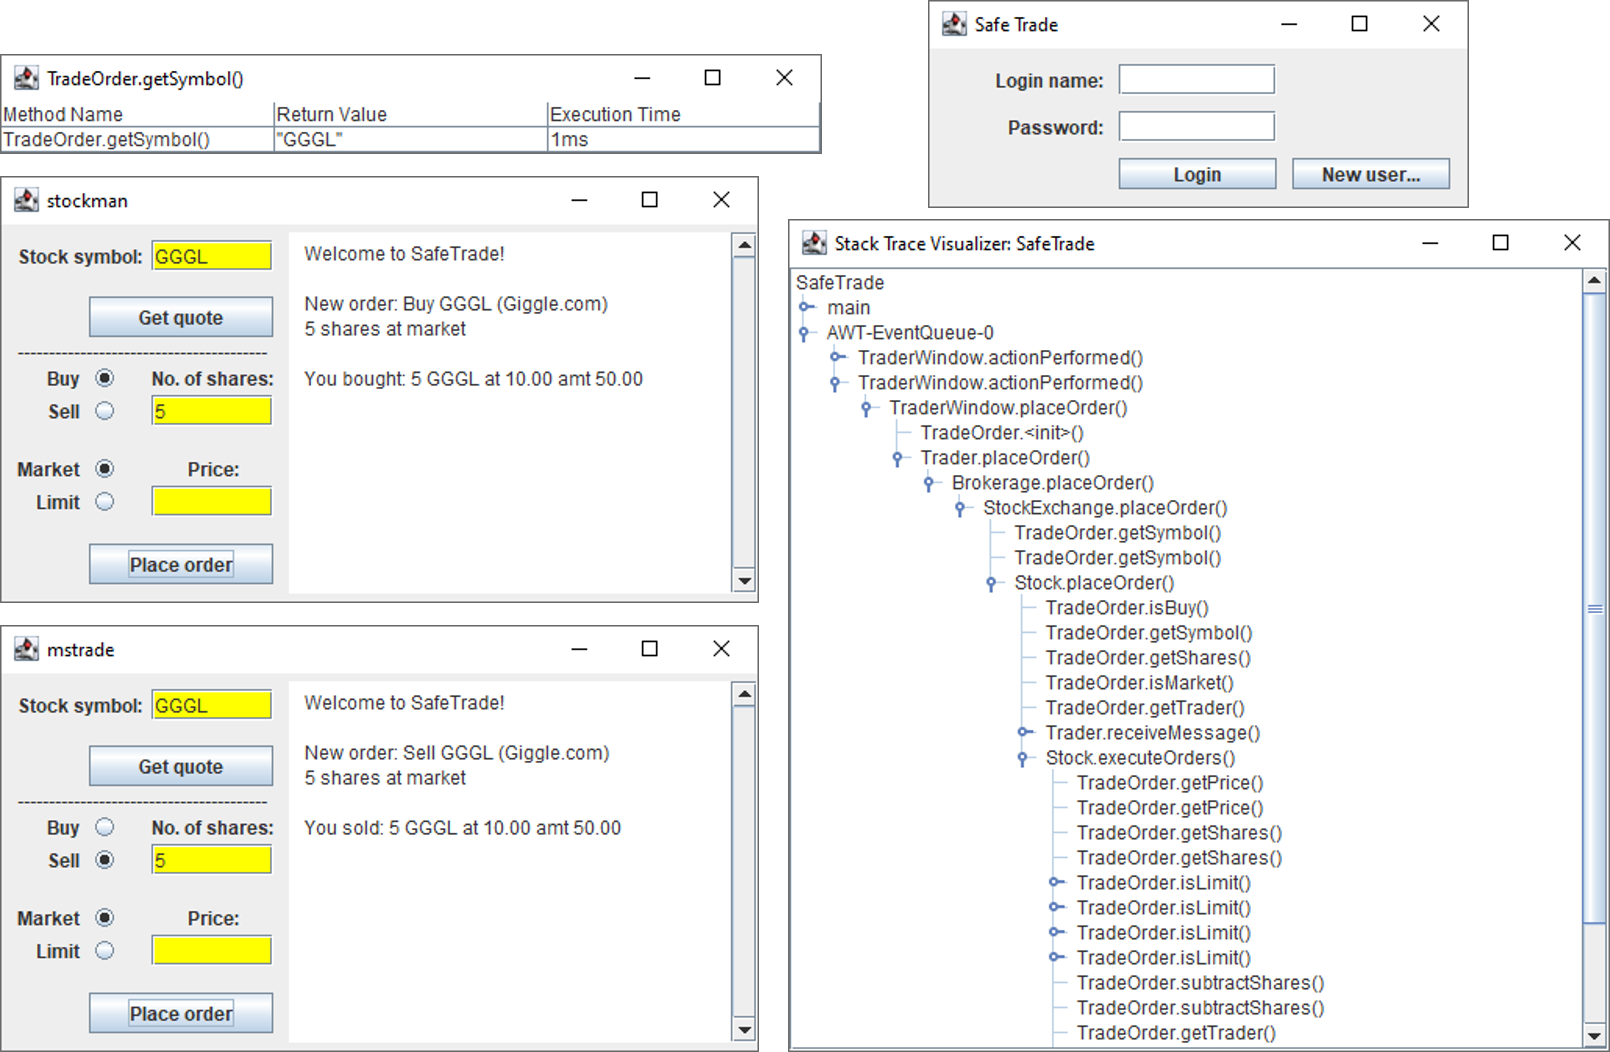
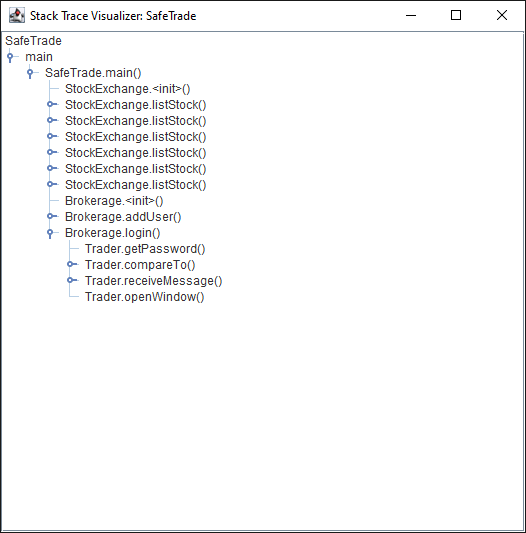
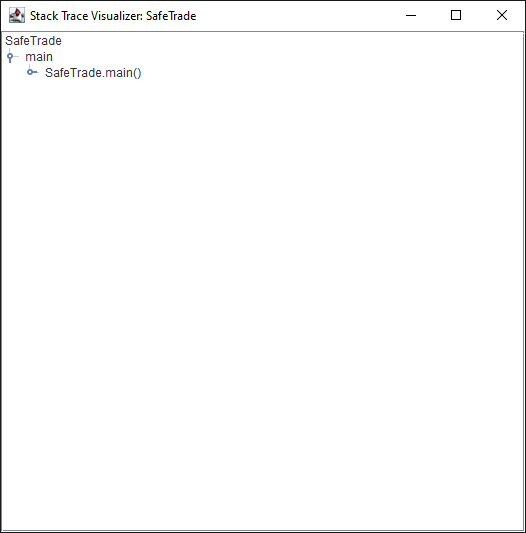
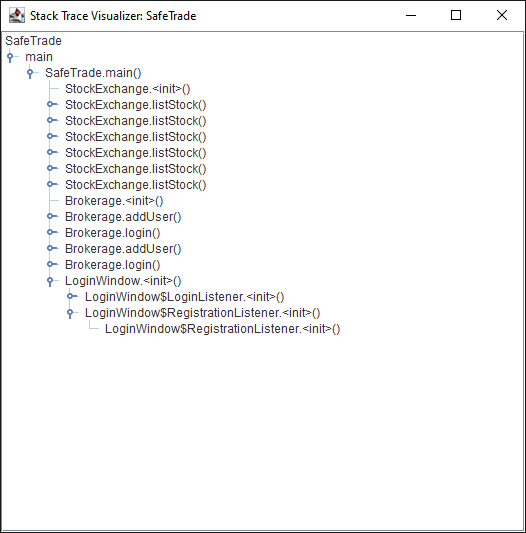
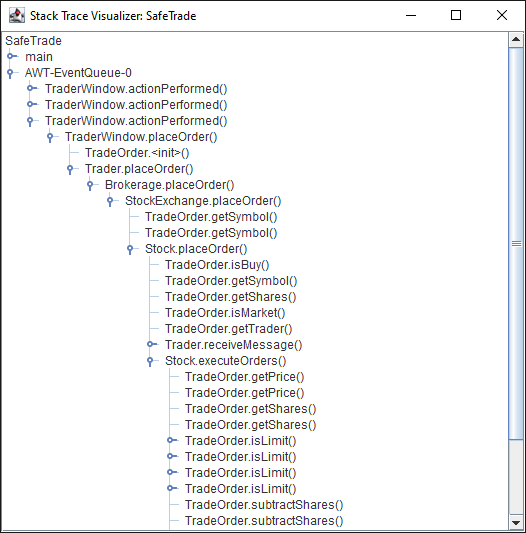
A tracer screen will open, and the stack trace will be updated in real time. Execution may be significantly slower when using the tracer.
-
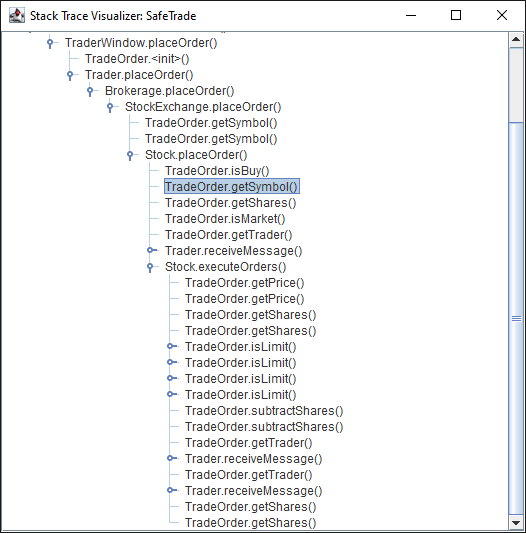
Methods can be expanded by clicking the expand icon to the left of the method name.
-
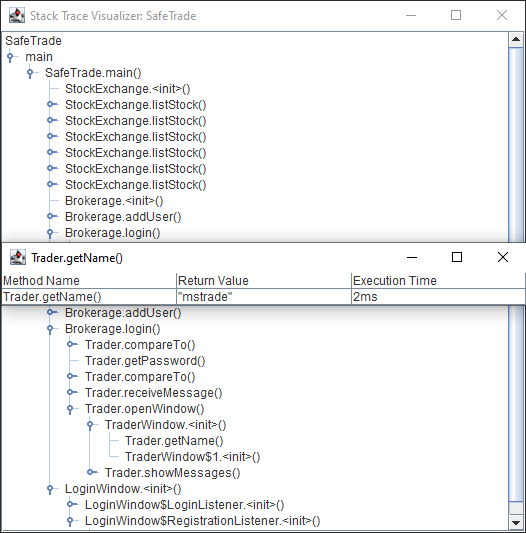
Clicking on a method name opens a popup which displays more information about the method.
-
The stack trace window will update in real time.
Other Information
- This program requires
jdbto be installed on your system.jdbis included injdk. - The program may occasionally prevent the compiled
jaror specifiedclassfile from being modified, even after the program has exited. This can be solved by killing allJava,jdk, andjdbprocesses through the system task manager or command line.